 Web Server Statistics for ghostlibrary.com Web Server Statistics for ghostlibrary.com
(Go To: Top: General Summary: Daily Summary: Hourly Summary: Domain Report: Organization Report: Operating System Report: Status Code Report: File Size Report: File Type Report: Directory Report: Request Report)
This report contains overall statistics.
Successful requests: 2,465
Average successful requests per day: 2,462
Successful requests for pages: 2,297
Average successful requests for pages per day: 2,294
Failed requests: 1,972
Redirected requests: 421
Distinct files requested: 378
Distinct hosts served: 664
Corrupt logfile lines: 96
Data transferred: 571.97 megabytes
Average data transferred per day: 571.58 megabytes
(Go To: Top: General Summary: Daily Summary: Hourly Summary: Domain Report: Organization Report: Operating System Report: Status Code Report: File Size Report: File Type Report: Directory Report: Request Report)
This report lists the total activity for each day of the week, summed over all the weeks in the report.
Each unit ( ) represents 60 requests
for pages or part thereof.
) represents 60 requests
for pages or part thereof.
day: #reqs: #pages: ---: -----: ------: Sun: 0: 0: Mon: 0: 0: Tue: 2461: 2293:
(Go To: Top: General Summary: Daily Summary: Hourly Summary: Domain Report: Organization Report: Operating System Report: Status Code Report: File Size Report: File Type Report: Directory Report: Request Report)
This report lists the total activity for each hour of the day, summed over all the days in the report.
Each unit () represents 6 requests
for pages or part thereof.
hour: #reqs: #pages: ----: -----: ------: 0: 80: 78:4: 64: 59:
5: 60: 56:
18: 90: 82:
(Go To: Top: General Summary: Daily Summary: Hourly Summary: Domain Report: Organization Report: Operating System Report: Status Code Report: File Size Report: File Type Report: Directory Report: Request Report)
This report lists the countries of the computers which requested files.
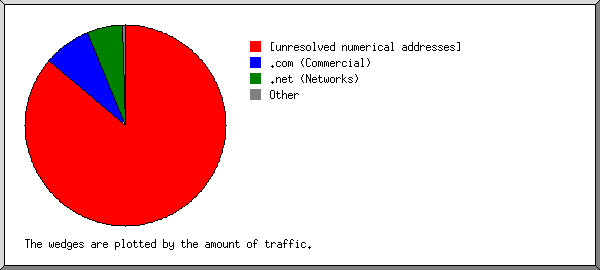
Listing domains, sorted by the amount of traffic.
#reqs: %bytes: domain
-----: ------: ------
 1816: 61.44%: [unresolved numerical addresses]
  313: 10.16%: .com (Commercial)
   81:  6.70%: [unknown domain]
   52:  5.34%: .vn (Vietnam)
    4:  4.02%: .ca (Canada)
   29:  2.27%: .info (Informational)
   21:  1.46%: .br (Brazil)
   61:  1.27%: .net (Networks)
    2:  1.13%: .bd (Bangladesh)
   13:  1.12%: .ar (Argentina)
   14:  0.86%: .ru (Russia)
    8:  0.83%: .mx (Mexico)
    6:  0.47%: [domain not given]
    6:  0.46%: .co (Colombia)
    4:  0.37%: .py (Paraguay)
    2:  0.25%: .kz (Kazakhstan)
    4:  0.23%: .cl (Chile)
    2:  0.23%: .ec (Ecuador)
    3:  0.23%: .uz (Uzbekistan)
    2:  0.21%: .ua (Ukraine)
    2:  0.13%: .by (Belarus)
    1:  0.12%: .bo (Bolivia)
    1:  0.12%: .vc (Saint Vincent and Grenadines)
    1:  0.12%: .ae (United Arab Emirates)
    1:  0.12%: .gy (Guyana)
    1:  0.11%: .az (Azerbaijan)
    1:  0.11%: .uy (Uruguay)
    1:  0.11%: .za (South Africa)
    2:       : .pl (Poland)
    3:       : .io (British Indian Ocean Territory)
    2:       : .de (Germany)
    1:       : .tr (Turkey)
    2:       : .cz (Czech Republic)
    1:       : .arpa (Arpanet)
    1:       : .id (Indonesia)
    1:       : .ro (Romania)
(Go To: Top: General Summary: Daily Summary: Hourly Summary: Domain Report: Organization Report: Operating System Report: Status Code Report: File Size Report: File Type Report: Directory Report: Request Report)
This report lists the organizations of the computers which requested files.
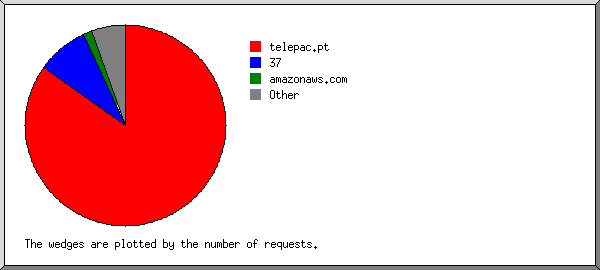
Listing the top 20 organizations by the number of requests, sorted by the number of requests.
#reqs: %bytes: organization
-----: ------: ------------
  899:  8.05%: 5
  149:  0.07%: 20
  128:  0.06%: 191.237
  115:  0.06%: czgdn.com
   95:  8.28%: 194.150
   81:  6.70%: [unknown domain]
   69:  5.63%: 185.138
   56:  0.51%: 43
   52:  5.34%: vn
   42:  0.01%: ahrefs.net
   38:  2.82%: petalsearch.com
   29:  2.27%: bacloud.info
   27:  1.17%: semrush.com
   27:  1.39%: 216.244
   27:  0.06%: amazonaws.com
   24:  2.77%: 45
   23:  1.74%: 172.252
   20:  2.33%: 178.210
   15:  0.96%: 185.255
   15:  1.78%: colocrossing.com
  534: 48.00%: [not listed: 244 organizations]
(Go To: Top: General Summary: Daily Summary: Hourly Summary: Domain Report: Organization Report: Operating System Report: Status Code Report: File Size Report: File Type Report: Directory Report: Request Report)
This report lists the operating systems used by visitors.
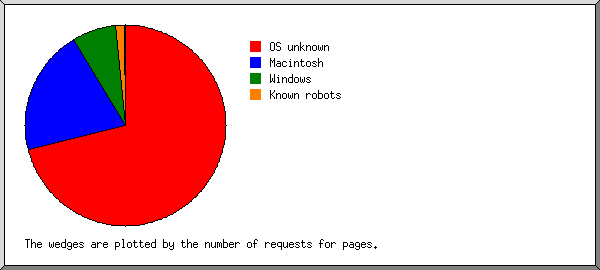
Listing operating systems, sorted by the number of requests for pages.
 #: #reqs: #pages: OS
--: -----: ------: --
 1:  1367:   1353: Windows
  :  1308:   1296:   Windows NT
  :    56:     55:   Unknown Windows
  :     3:      2:   Windows XP
 2:   322:    271: Macintosh
 3:   236:    176: OS unknown
 4:    75:     63: Unix
  :    73:     61:   Linux
  :     2:      2:   Other Unix
 5:    72:     42: Known robots
(Go To: Top: General Summary: Daily Summary: Hourly Summary: Domain Report: Organization Report: Operating System Report: Status Code Report: File Size Report: File Type Report: Directory Report: Request Report)
This report lists the HTTP status codes of all requests.
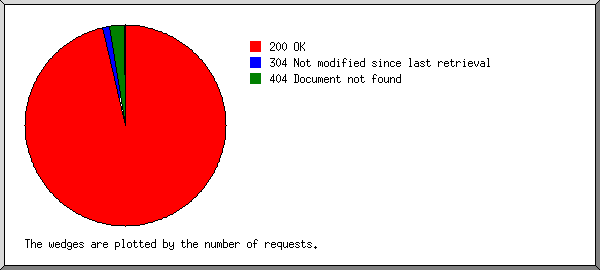
Listing status codes, sorted numerically.
#reqs: status code
-----: -----------
 2417: 200 OK
    7: 206 Partial content
  421: 301 Document moved permanently
   41: 304 Not modified since last retrieval
 1969: 404 Document not found
    3: 405 Method not allowed
(Go To: Top: General Summary: Daily Summary: Hourly Summary: Domain Report: Organization Report: Operating System Report: Status Code Report: File Size Report: File Type Report: Directory Report: Request Report)
This report lists the sizes of files.
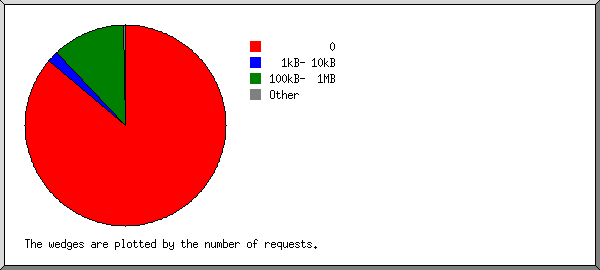
       size: #reqs: %bytes:
-----------: -----: ------:
          0:    44:       :
   1B-  10B:     0:       :
  11B- 100B:     0:       :
 101B-  1kB:    16:       :
  1kB- 10kB:   769:  0.47%:
 10kB-100kB:   922:  6.90%:
100kB-  1MB:   700: 78.78%:
  1MB- 10MB:    14: 13.86%:
(Go To: Top: General Summary: Daily Summary: Hourly Summary: Domain Report: Organization Report: Operating System Report: Status Code Report: File Size Report: File Type Report: Directory Report: Request Report)
This report lists the extensions of files.
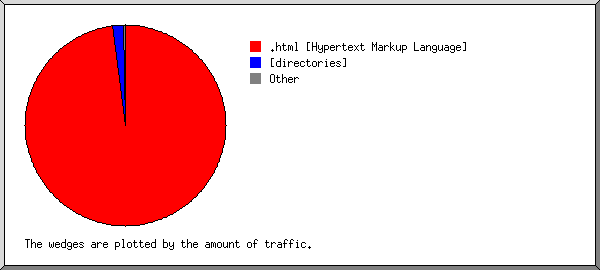
Listing extensions with at least 0.1% of the traffic, sorted by the amount of traffic.
#reqs: %bytes: extension
-----: ------: ---------
 1705: 85.12%: .html [Hypertext Markup Language]
   22: 13.94%: .jpg  [JPEG graphics]
  592:  0.34%: [directories]
   16:  0.24%: .png  [PNG graphics]
    5:  0.15%: .pdf  [Adobe Portable Document Format]
  125:  0.22%: [not listed: 11 extensions]
(Go To: Top: General Summary: Daily Summary: Hourly Summary: Domain Report: Organization Report: Operating System Report: Status Code Report: File Size Report: File Type Report: Directory Report: Request Report)
This report lists the directories from which files were requested. (The figures for each directory include all of its subdirectories.)
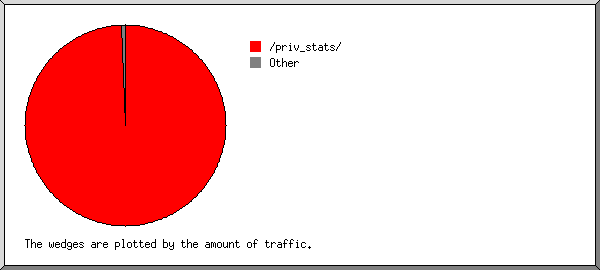
Listing directories with at least 0.01% of the traffic, sorted by the amount of traffic.
#reqs: %bytes: directory
-----: ------: ---------
 1431: 62.46%: /priv_stats/
  262: 22.71%: http://
  503: 13.32%: /max/
  203:  0.97%: [root directory]
   11:  0.24%: /terrible/
   20:  0.16%: /games/
   11:  0.11%: /projectcalliope/
    8:  0.01%: /images/
   16:  0.01%: [not listed: 2 directories]
(Go To: Top: General Summary: Daily Summary: Hourly Summary: Domain Report: Organization Report: Operating System Report: Status Code Report: File Size Report: File Type Report: Directory Report: Request Report)
This report lists the files on the site.
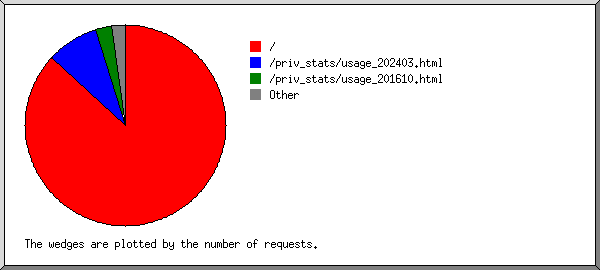
Listing files with at least 20 requests, sorted by the number of requests.
#reqs: %bytes:          last time: file
-----: ------: ------------------: ----
  894:  7.59%: Jul/ 8/26 12:02 AM: /priv_stats/usage_202512.html
  420:  0.20%: Jul/ 7/26 11:54 PM: /max/
  114:  0.07%: Jul/ 7/26 11:46 PM: /
  101: 11.88%: Jul/ 7/26 11:53 PM: /priv_stats/usage_202607.html
   73:  0.09%: Jul/ 7/26 11:34 PM: /robots.txt
   59:  0.02%: Jul/ 7/26 11:51 PM: /max/contact.html
   57:  6.45%: Jul/ 7/26 11:43 PM: /priv_stats/usage_202303.html
   40:  4.31%: Jul/ 7/26 11:47 PM: /priv_stats/usage_202408.html
   31:  3.40%: Jul/ 7/26  9:46 PM: /priv_stats/usage_202206.html
   27:  3.05%: Jul/ 7/26 11:47 PM: /priv_stats/usage_202302.html
   25:  2.45%: Jul/ 7/26 11:27 PM: /priv_stats/usage_201912.html
   20:  2.18%: Jul/ 7/26 10:59 PM: /priv_stats/usage_202402.html
  604: 58.31%: Jul/ 7/26 11:58 PM: [not listed: 366 files]
(Go To: Top: General Summary: Daily Summary: Hourly Summary: Domain Report: Organization Report: Operating System Report: Status Code Report: File Size Report: File Type Report: Directory Report: Request Report)


